
Support and resistance are two of the most popular concepts of technical analysis in forex trading. These levels are prices at which there is a barrier where the price would either stop or reverse at the given level. In this blog, let GVD Market explain support and resistance in Forex.
What’s Support And Resistant
Support is a level that prevents prices from being pushed downwards. Resistance is the level that prevents prices from being pushed upwards. There are three golden rules for support and resistances. The longer the price stays at the support or resistance level, the stronger it gets. This happens because the more obvious the level becomes, the more traders will be placing their buy or sell orders there. When a support or resistance level breaks, the stronger it has been and the stronger the next move will be. In theory, every support should become resistance and every resistance should become support.

Here you can see the price was rising and met resistance when it broke through. It was the same level from the upside, giving him the new support. The same can be seen in downtrend. Price was falling and it met support. It managed to break through and tested this level as the new resistance. To further illustrate, consider how these levels act like a memory for the market—traders remember where price struggled before, and this psychological reinforcement often drives future reactions at those same points.
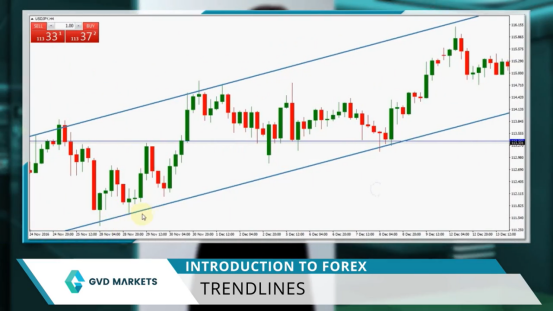
Diagonal Support And Resistance Line
Support and resistance lines can be not only horizontal but also diagonal. Diagonal support and resistance lines are called trend lines, and they are drawn by connecting two or more price peaks or bottoms. Trend following is one of the most basic and profitable trading strategies.
Let me explain how this works. If a currency pair is in an uptrend, traders wait for the price to approach its trend line and if it acts as a support, they buy. Once the price bounces beyond that level. Conversely, if the price is trending down, traders wait for it to approach its trend line as the resistance and sell after it bounces. Remember, the more time support and resistance levels have been tested, the stronger they get. The same goes for the trend lines. The biggest problem with trend lines is that unlike horizontal support or resistance, they can be very subjective. Tell five different people to draw a trend line and you’ll get five different trend lines. This subjectivity arises because traders might prioritize different peaks or troughs based on their timeframe or trading style, yet the core principle remains unchanged: trend lines guide expectations.
A trend channel is another great tool for a trend trader. In order to make a channel, all you have to do is draw a line parallel to your trend line. Channels are great for setting your price target. Let’s take a look at this example. You just went long after the price bounced from a rising trend line, but you didn’t know where to take profit. By drawing a channel, you can project how high the price is going to rise, and based on it, you can calculate your target profit. Great stuff. Additionally, channels can help identify potential reversal points if the price breaks out of the channel, signaling a shift in momentum that savvy traders can exploit.
Final Thought
A trader should really be skilled and acknowledged to make profit from the forex market. At GVD Markets, top forex brokers, here we provide live forex prices, forex news, forex profit calculator. If you want to become a top trader of the forex market, visit our GVD Markets Education Academy to learn more about advanced forex trading now! Beyond the basics of support and resistance, mastering these concepts requires practice and real-time application—tools and education like those offered at GVD Markets can bridge the gap between theory and profitable execution.
Wonderful lesson. Never thought that support and resistant could be this easy to understand.