
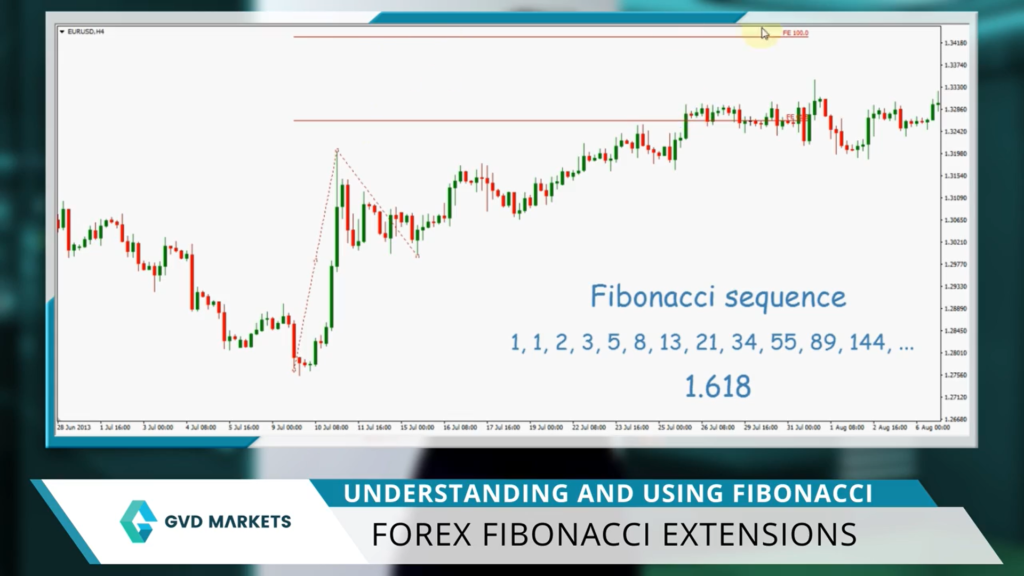
Fibonacci was an Italian mathematician famous for discovering the Fibonacci sequence. The sequence looks at this. Every number in the sequence is simply the sum of the two previous numbers. So one plus one equals two, One plus two equals three, Two plus three equals five, and so on. GVD Markets, the best forex broker will introduce this famous concept in this passage.
Golden Ratio
The sequence itself is not that important. It’s the ratio of these numbers that matters If you measure the ratio of any number to the succeeding higher number, you will get point six on. If you measure the ratio between any second number, you will get the ratio 0.382. This is called the golden ratio.
The golden mean can be found in everything in nature, starting from Adam and Eve’s male to female behavior ratio. So why am I telling you all this? As you may have guessed, the same ratio is believed to work in Fors market.
Fibonacci in Forex
Traders used the Fibonacci ratios to find the potential reversal points in the market as the price tends to find support and resistance at these levels.
The five key Fibonacci ratios are 23.6%, 38.2% to 50%, 61.8%. Take a look at this chart. You will notice that the Fibonacci retracement is considered between the low and high and the price starts reversing from the 61 8% of the tracement.
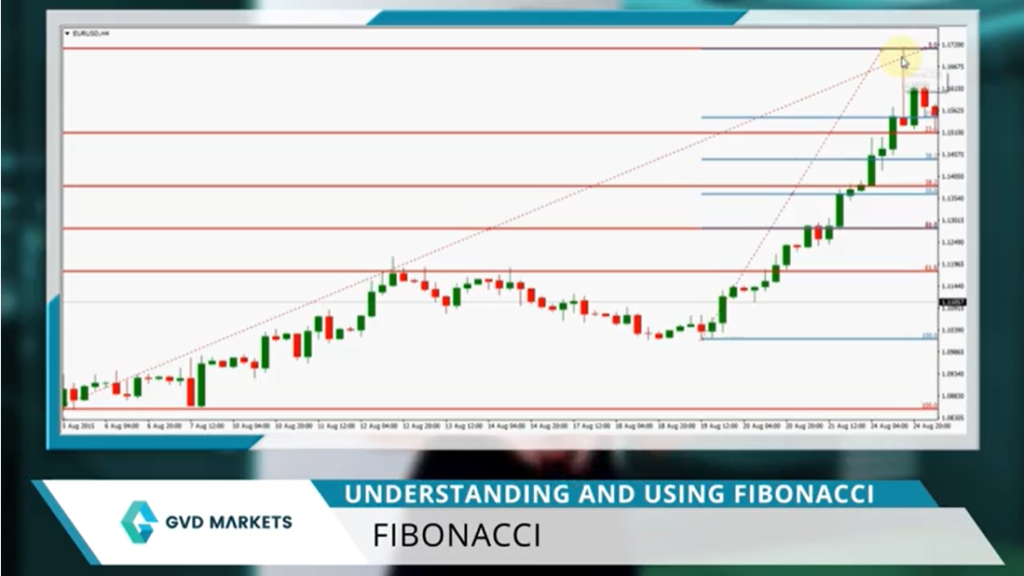
The best way to use the Fibonacci levels is to draw separate swings toward women who move, Also look for the levels that overlap levels, and generally they should provide stronger support and resist. Take a look here. We draw the first Fibonacci from the start of the uptrend all the way up to the most recent high. Then we draw the second Fibonacci from the most recent low to the most recent swing high. Both the fibonaccis will have an overlap at a point which is considered to be a strong support.
Now you can either wait for the price to retrace this level to your long, or if you’re already long, you can put your protective stops under this level.
Forex Fibonacci Extensions
The Fibonacci extension is a tool that helps you set profit targets similar to the Fibonacci retracement. This tool also uses the Fibonacci sequence ratios. Here’s a quick recap of how the sequence looks. The ratio between any number in the sequence and the previous number is 1.618. Let’s take a look at how to use these in your trading.
In an updrenft, you draw a Fibonacci extension during the most recent swing load to the most recent swing high, and then back to the latest because i’ show you the two main levels at which you should set your price targets 100% and 1.61 P1 extension. As you can see, the price hit the first target also hit the second target before reversing completely. Let’s do the same for the downtrend. So draw the extension from the most recent sweepego flow to the most recent swing low and back to the Play Center, which gives your targets here and here.
Learn Forex Fibonacci Fan and Arcs
Fibonacci, lesson Learn for Z charge, we will Samuel. Oh my God, common is beacci fans and arcs. Fibonacci ratios are used in different ways by making use of Fibonacci fans and Arcs tools to find potential support and resistance to.
Just like other Fibonacci tools, fans are drawn from the swing low to the swing high, while the tracing tread lines of 38.2%, 50%, and 61.8% can seen on the chart. The tread lines can then be used to find the support. As you can see on the chart, the price bounced several times from the fan lines. As the price breaks, the 61.8% lower, it is signaling a trend consolidation. It doesn’t necessarily mean that the trend is reversing.
It could also be that the trend is paused and maybe second arrange, and therefore we should use range trading. Fibonacci Ars work exactly the same. They are drawn from the swing high to the swing low to show the potential support resistance areas. Here you can see the prices trading down along the 38.2% until it breaks the previous lows and then cont
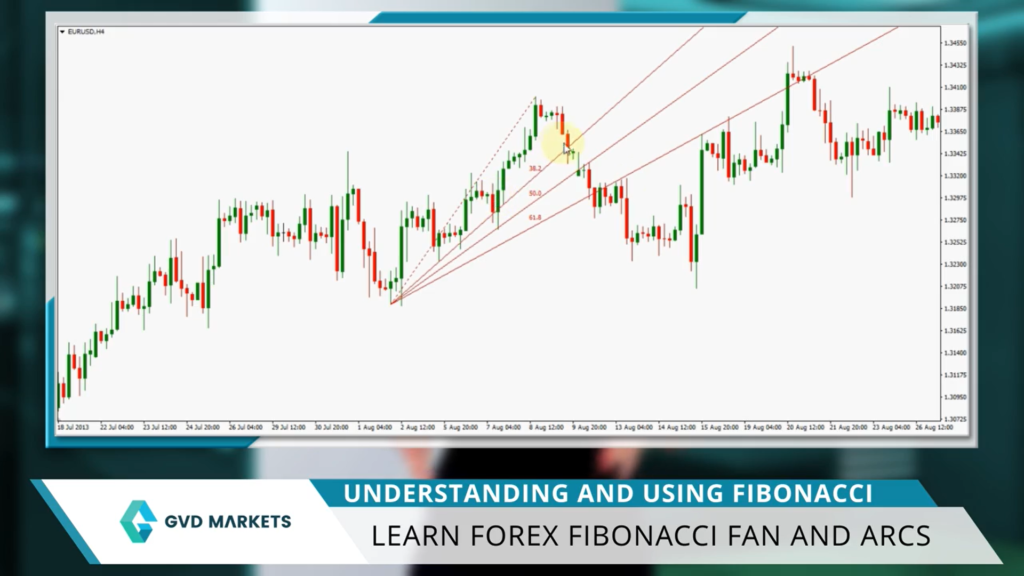
inues to take the lower leg Maes.
Learn Forex Combining Fibonacci with other technical analysis tools
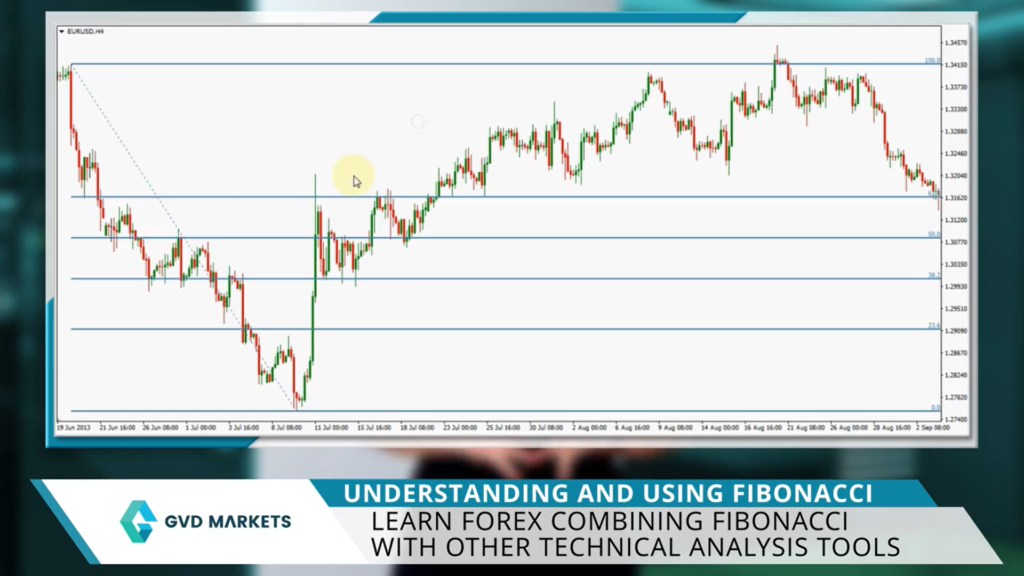
Learn forex, combined Fibonacci and other technical analysis tools. Since drawing Fibonacci retracements are very subjective, it’s useful to combine it with other technical analysis tools. Binding fibs with polarity chain Fibonacci retracement is to look for the Fib levels, which interacts with old support and resistance lines. Like here, price broke the price highs and started pulling back Old resistance shed on the new support you might be going along on the retest of this level.
Many traders have problems choosing their stop loss levels. Fibs are especially useful in situations like this, as you can simply put your stop lossps a couple of pips below the 61.8% returnments. Combining fibs with trend lines and channels. Take a look here. The price is in a strong long after making the next leg higher, you need to wait for retracement before going along.
By drawing Fib retreatcement, you can project the potential point where the price will hit the trend line and set your buy orders there? Combining fibs with RSI, we’ve already learned how to use the RSI momentum triggers to help us determine price reversals. Combining that with fiber, tracecements works like magic. Take a look here.
The price is stalling at the 38.2% fiber tracecement Normally it would be risky to sell based only on fiber tracecement as it could go up further, However, as the RSI has already broken the bullish momentum, it’s signaling that the retracement uptren has finished and the prices ready to resume down.
Final Thought
GVD Markets provides the best forex trading app platform. If you are a forex exchange trader, check on GVD Markets to learn more about forex on our Education Academy.
get educated by real traders, for example at the GVD Institute of Trading and Portfolio Management.
Very helpful, thanks